Why Some Characters Keep Returning to the Top
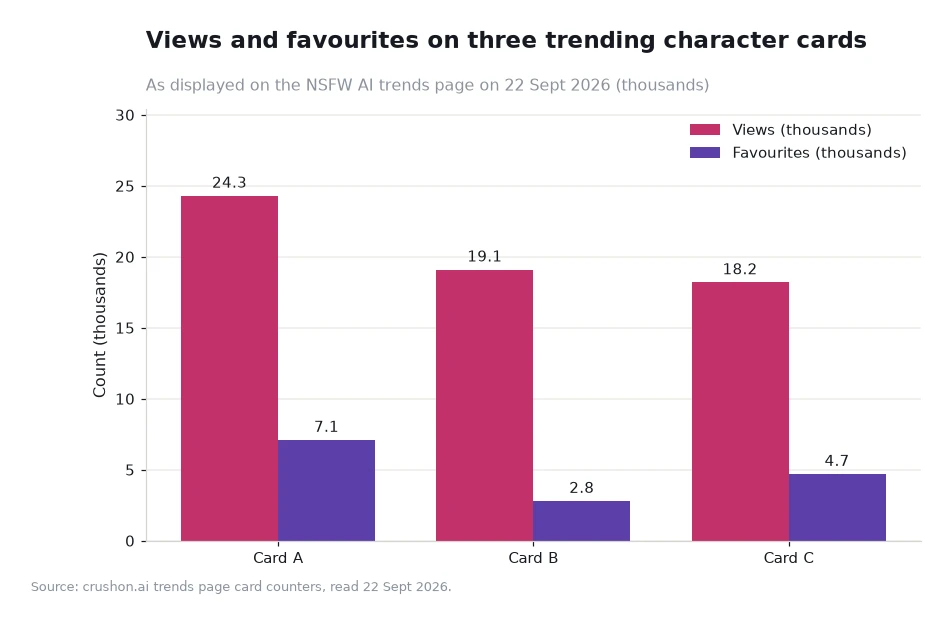
A card that reappears on the weekly list is doing something a one-week wonder is not: it holds readers past the first visit. On 22 Sept 2026 the three leaders on Crushon's chart showed 24.3M, 19.1M and 18.2M views, with favourites of 7.1K, 2.8K and 4.7K, and the card ranked third on views carried the second-highest save rate of the three. Repeat performance shows up in the ratio rather than in the position.

Key takeaways
- Position is temporary; the save rate is the durable signal. 7.1K favourites on 24.3M views is 0.029%, roughly 292 per million.
- Card C shows the repeat pattern most clearly: third on views at 18.2M, second on favourites at 4.7K, a rate of 0.026%.
- Three things sustain a run: a creator who publishes consistently, tags that match live search vocabulary, and a card that readers return to.
- The refresh happens every Thursday, so a sustained run is measured in weeks on the chart rather than in days.
Repeat performance is a ratio story
Views and favourites move at different speeds. A card can gather several million views inside one week on the strength of a single well-placed tag or an announcement from its creator, and traffic of that kind will not hold a position on its own. What keeps a card near the top of the chart is the second counter: readers who arrive, decide the character is worth keeping, and later come back with a reason to reopen it. That is a slower process than a traffic spike, and it is the one a weekly refresh is capable of measuring.
Dividing the counters makes the difference legible. Card A's 7,100 favourites against 24,300,000 views is 0.029%. Card B's 2,800 against 19,100,000 is 0.015%. Card C's 4,700 against 18,200,000 is 0.026%. Card B has the most views of the two smaller cards and the weakest save rate of the three, which is the classic one-week pattern: heavy arrival, light retention. Nothing about that card is broken; it simply reached more people than it persuaded.
The same ratio also explains why a card can stay visible without ever leading. A card that converts a slightly higher share of its visitors climbs a little each week, and small weekly gains compound over a month. Position eight, held for four consecutive refreshes, represents more durable interest than position two that disappears the following Thursday. That is also why the chart is worth reading across weeks rather than as a single page: the sequence carries the information, and any one Thursday is only a frame of it.
What actually sustains a run
The first factor is creator cadence. Cards carry a "by" credit, and a maker who publishes on a predictable rhythm keeps returning to readers' attention without needing a new audience each time. The second is tag alignment: the trends page labels cards with tags such as Unfiltered, Submissive, Fictional, OC and Female, and the character search page collects the popular tags circulating that week. A card whose labels match the words readers actually use is findable for longer than one whose labels are idiosyncratic.
The third factor is the harder one to fake — whether the conversation itself gives a reader a reason to come back. That is where continuity matters: a character that keeps a thread's history lets a second session begin where the first ended, and a second session is exactly what turns a view into a favourite. None of this is a guarantee, and a card can lose its run for reasons that have nothing to do with quality. The point is that the three factors are visible from the outside, which means a reader can look for them rather than guess.
| What sustains a run | Visible evidence | What ends it |
|---|---|---|
| Creator cadence | New cards from the same credit line appearing across several weeks | A long gap between releases |
| Tag alignment | Labels that match the tags rising in search that week | A tag falling out of circulation |
| Reader retention | A favourite rate holding near the top of the page, as Card C's 0.026% does | Traffic arriving without repeat visits, the Card B pattern at 0.015% |
| Presentation | A description that sets expectations accurately | Mismatch between what the card promises and what the thread delivers |
| Timing | Position held across consecutive Thursday refreshes | A single week of high arrivals with nothing behind it |
Worked example: a six-week projection from the counters
Start with the rates, computed from the counters read on 22 Sept 2026. Card A: 7,100 ÷ 24,300,000 = 0.000292, or 0.029%. Card B: 2,800 ÷ 19,100,000 = 0.000147, or 0.015%. Card C: 4,700 ÷ 18,200,000 = 0.000258, or 0.026%.
Now assume, illustratively, that each card keeps drawing 300,000 views a week for six weeks. At Card C's rate that is 300,000 × 0.000258 = 77 new favourites a week, or 77 × 6 = 462 over the six weeks. At Card B's rate it is 300,000 × 0.000147 = 44 a week, or 264 across the same period. The difference is 198 favourites from identical traffic, which is why the cheaper-looking card keeps its place and the busier one does not. These projections are illustrative arithmetic, not platform data, and they assume a steady arrival rate that real weeks rarely deliver.
Using the weekly list as a repeat-spotter
The most productive way to read the weekly NSFW AI characters list is to compare it with the previous week, which is what the weekly rankings view is for. Two lists side by side turn a static chart into a record of who is holding on. Anyone who wants the underlying cards rather than the order can browse the nsfw ai chat chart itself, while a wider survey of profiles is better served by the character search page, where the tags that drive a run are visible in bulk.
Two cautions belong with the method. A high position is a statement about attention, not about fit, and the most popular card of the week may be nothing like what you want. Equally, a card that slips out of the top twenty has not necessarily got worse — the refresh simply measures a different seven days.
Frequently asked questions
Why do the same cards stay near the top?
Because a weekly chart rewards retention rather than a single burst of traffic. A card that converts a slightly higher share of arrivals into favourites adds a little each week, and those additions keep it visible across consecutive refreshes.
Can a card return after dropping out?
Yes. Each Thursday takes a fresh reading, so a card that was outside the top twenty can come back if the following week's counters put it inside again. Nothing in the page is a permanent record.
Should I just pick the highest card on the list?
No. Position measures attention during one week. A card ranked third with a stronger save rate is often the safer choice for a reader who intends to come back to it.
Watch the second column, not the first
Each Thursday, note the top three positions and their favourite counts, then compare them with the previous week before opening anything. Two minutes of that habit tells you which runs are real and which are one-week arrivals. Then make your own choice from the ratio you calculated rather than from the order the page happened to print.
Data and sources: the view and favourite counters displayed on the NSFW AI trends page[1], read 22 Sept 2026. The six-week projection is illustrative arithmetic, not platform data. Suitable for readers aged 18+.